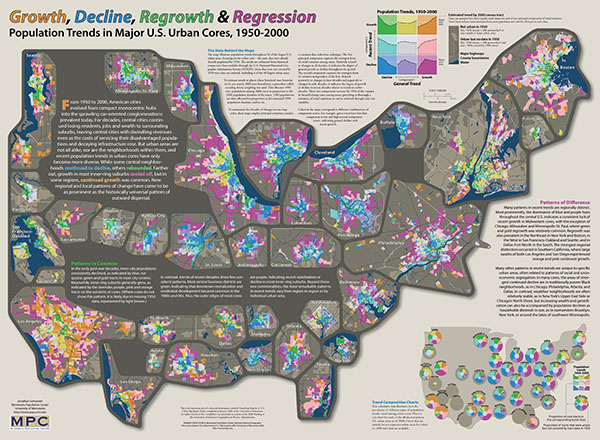
How to illustrate 5 decades of population changes throughout U.S. cities?
Historical U.S. census tract statistics and boundary data are now freely available online through the National Historical Geographic Information System (NHGIS). As a student of cartography and geography working on the NHGIS project, I focused my doctoral research on illustrating and interpreting long-term tract population trends through a single comprehensive display. This website presents the results.
Poster formats
Print dimensions: 30 in. x 22 in.
Conference presentations
- AAG 2010:
Relationships between long-term population changes and neighborhood characteristics in U.S. urban cores - AAG 2009:
Beyond small multiples and animation: Trend summary maps of urban population - AAG 2007:
Constructing time series of U.S. census tract data to analyze long-term urban population trends - AAG 2005, with Mark Lindberg:
Challenges and new possibilities for visual exploration of historical U.S. census data
Article
- Bicomponent trend maps:
A multivariate approach to visualizing geographic time series
Cartography and Geographic Information Science 37(3), July 2010, pp. 169-187- A technical introduction to bicomponent trend maps and matrices, including an assessment relative to other multivariate mapping strategies.
- A higher-quality version is available through the publisher's website
Dissertation
- Visualizing Patterns in U.S. Urban Population Trends
University of Minnesota, 2009- Provides in-depth explanation and analysis of the maps. It also presents all of the maps in a series of letter-sized pages in its appendix.
Related work